The ZODHA Internal Data Intelligence and Analytics Platform (ZIDIAAP) is an enterprise-grade analytics product designed to ingest, process, govern, analyze, and visualize large volumes of structured and unstructured data from multiple sources and formats. As ZODHA's business continues to grow, the Company requires scalable systems to collect, process, validate, integrate, and analyze data from multiple internal and external sources. These systems are necessary to support business reporting, operational visibility, automation, data quality, and future product development.
The platform enables organizations to generate dynamic ad-hoc reports, predictive insights, dashboards, and data-driven recommendations.
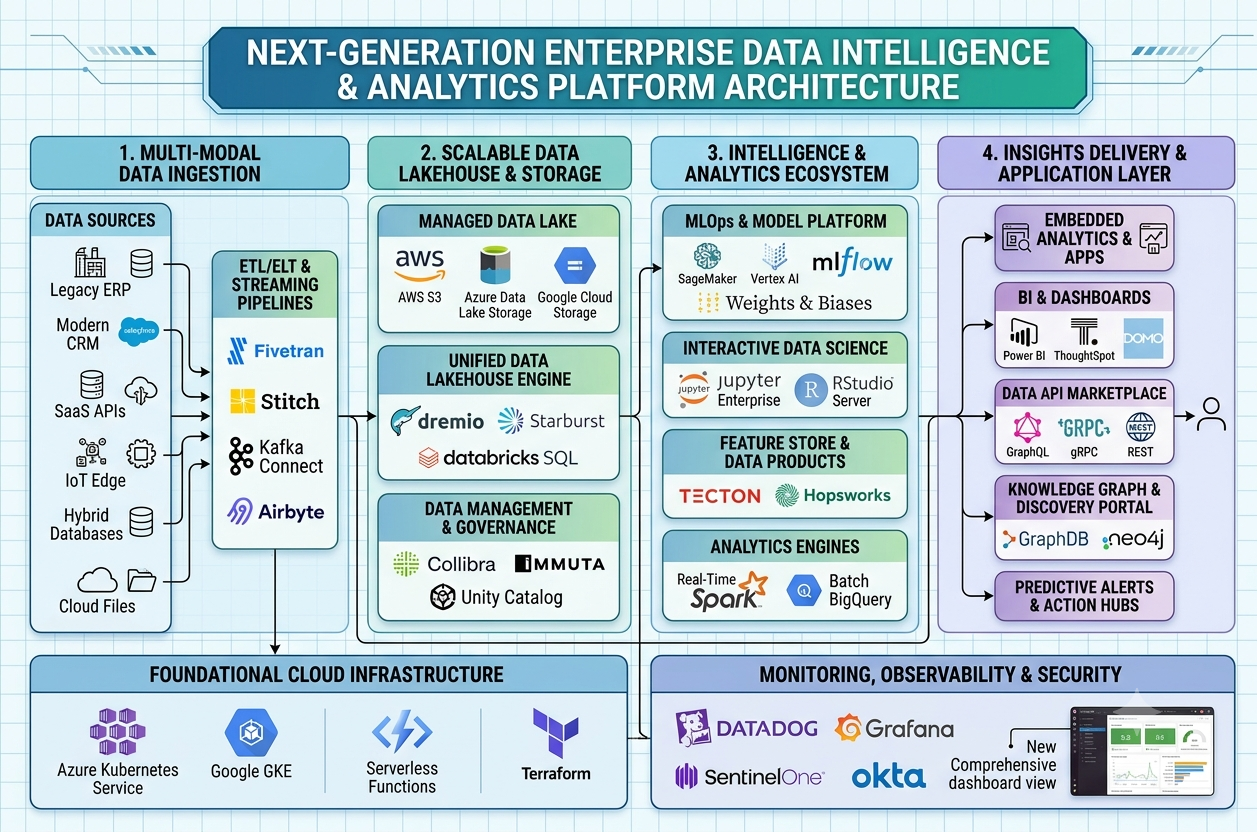
Unified Data Democratization: Empowers non-technical business teams to query data, build dashboards, and generate AI insights without waiting on engineering bottlenecks.
Speed-to-Insights: Pre-built data connectors, managed ETL pipelines, and automated Lakehouse infrastructure cut the time-to-value for enterprise analytics from months to days.
Plug-and-Play Governance & Security: Out-of-the-box compliance, data masking, and role-based access control (RBAC) reduce administrative overhead for corporate security teams.
Multi-Tenant Control Plane: Centralized management console handling tenant provisioning, subscription billing tiers, security policies, and global system monitoring.
Elastic Compute & Storage Tier: Scalable cloud-native compute layers (utilizing serverless Spark, Presto/Trino, and managed data lakes) that scale up or down based on active tenant queries.
Managed Data Ingestion Hub: Native connectors for popular enterprise SaaS tools (Salesforce, Jira, Zendesk, ERPs) allowing organizations to sync their operational data effortlessly.
API-First & Headless Analytics: Comprehensive REST and GraphQL APIs enabling businesses to embed analytics directly into their own internal client-facing applications.
Tiered Pricing Structure:
Standard/Team: Geared toward mid-market companies needing standard BI dashboards, basic batch ingestion, and pre-built connectors.
Enterprise: Advanced AI/ML model deployment (Kubeflow/SageMaker integration), real-time streaming analytics, dedicated feature stores, and enterprise-grade data governance (Apache Ranger/Collibra).
Deployment Flexibility: Offered as a fully managed Public Cloud SaaS (hosted on AWS/Azure/GCP) or via a Hybrid/Virtual Private Cloud (VPC) model for strict compliance and data residency requirements.
Secure Access. Quick Onboarding. Get to Insights Faster.
Transform your data into actionable insights with a secure, scalable, and intuitive onboarding experience designed for organizations of all sizes. ZIDIAAP streamlines every step of your setup journey—from initial sign-in to connecting your data sources and inviting your team.
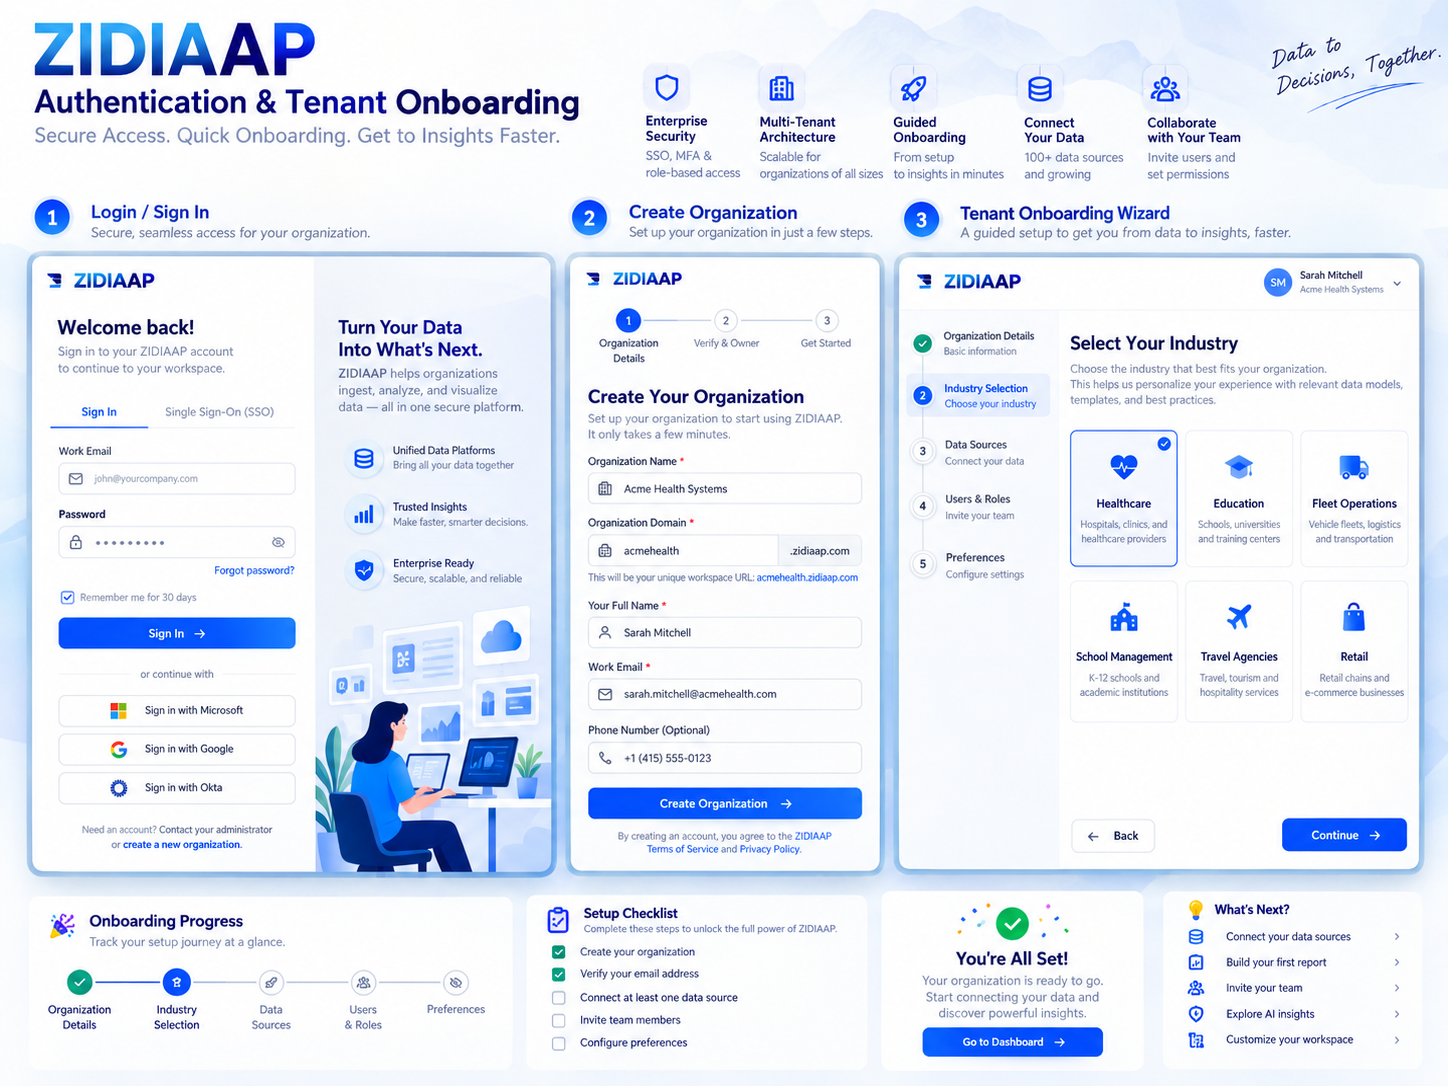
Secure, seamless access to your workspace with support for traditional email/password logins, “Remember me” functionality, and secure Single Sign-On (SSO) providers like Microsoft, Google, and Okta.
Set up your organization in just a few clicks. Define your organization name, unique workspace domain , and administrator profile details to instantly provision your environment.
A step-by-step guided setup tailored to your specific vertical. Choose from predefined industries (such as Healthcare, Education, Fleet Operations, School Management, Travel Agencies, or Retail) to personalize your data models, templates, and best practices.
Keep track of your setup journey at a glance using a live progress tracker covering Organization Details, Industry Selection, Data Sources, Users & Roles, and Preferences.
Complete your configuration, verify your email, connect your initial data sources, and jump straight to your dashboard to start building your first reports and customizing your workspace.
Data to Decisions, Together.
Empower your organization with ZODHA’s internal data intelligence platform, designed to seamlessly ingest, transform, store, analyze, visualize, and integrate data at scale. The ZIDIAAP dashboard provides a comprehensive command center to monitor data pipelines, track quality metrics, and surface AI-driven insights in real time.
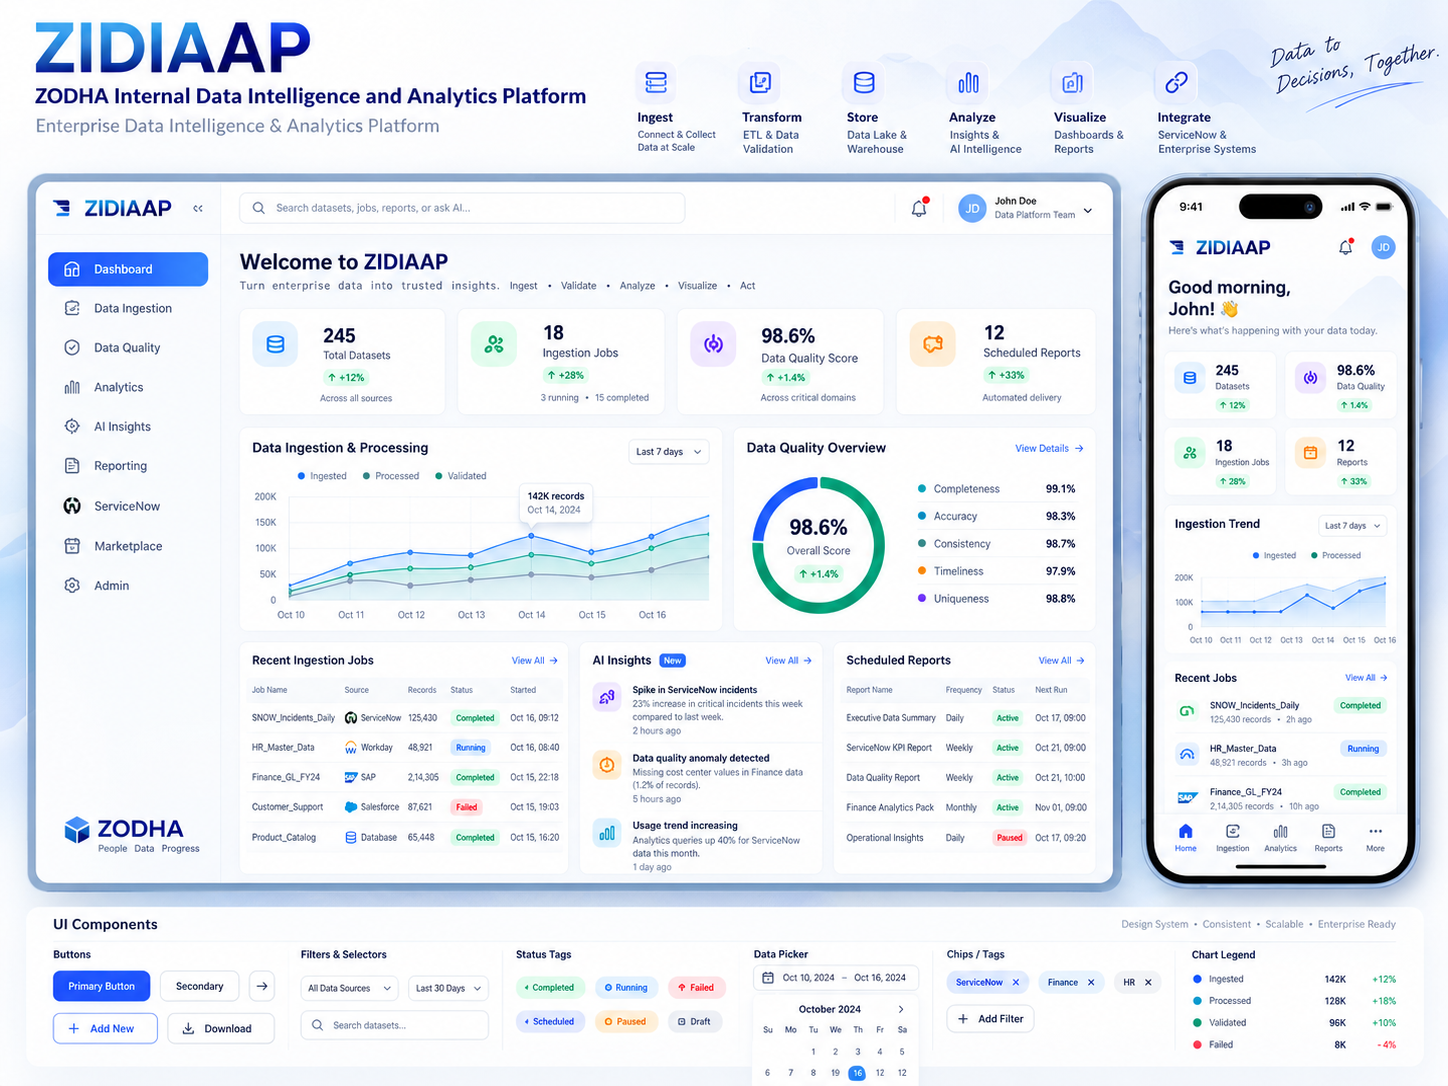
Track core data assets at a glance, including total datasets (245 active across all sources, up 12%), active ingestion jobs (18 jobs running and completed, up 28%), overall data quality score (98.6%, up 1.4%), and scheduled reports (12 automated deliveries, up 33%).
Monitor real-time trends for ingested, processed, and validated data over custom periods (e.g., last 7 days), displaying peak pipeline volume metrics such as 142K records processed on peak days.
Ensure top-tier governance with a holistic breakdown of key data health vectors: Completeness (99.1%), Accuracy (98.3%), Consistency (98.7%), Timeliness (97.9%), and Uniqueness (98.8%).
Audit ongoing or historical data loads from sources
like ServiceNow, Workday, SAP, Salesforce, and
internal databases, featuring clear status tags
(Completed, Running,
Failed).
Surface proactive automated flags—such as AI-detected spikes in incident trends or cost anomalies—alongside a management portal for daily, weekly, and monthly executive reporting packs.
Access the full power of your enterprise intelligence platform on the go with a fully optimized mobile dashboard view, ensuring your metrics and pipeline alerts are always at your fingertips.
Bring in data from any source. Seamlessly ingest, map, and monitor.
The Data Ingestion module within ZIDIAAP empowers enterprise teams to connect, collect, and unify data at scale. Whether you are uploading raw files, linking to native cloud storage, or synchronizing real-time streaming services, ZIDIAAP offers a robust, centralized workspace to manage your pipeline requirements.
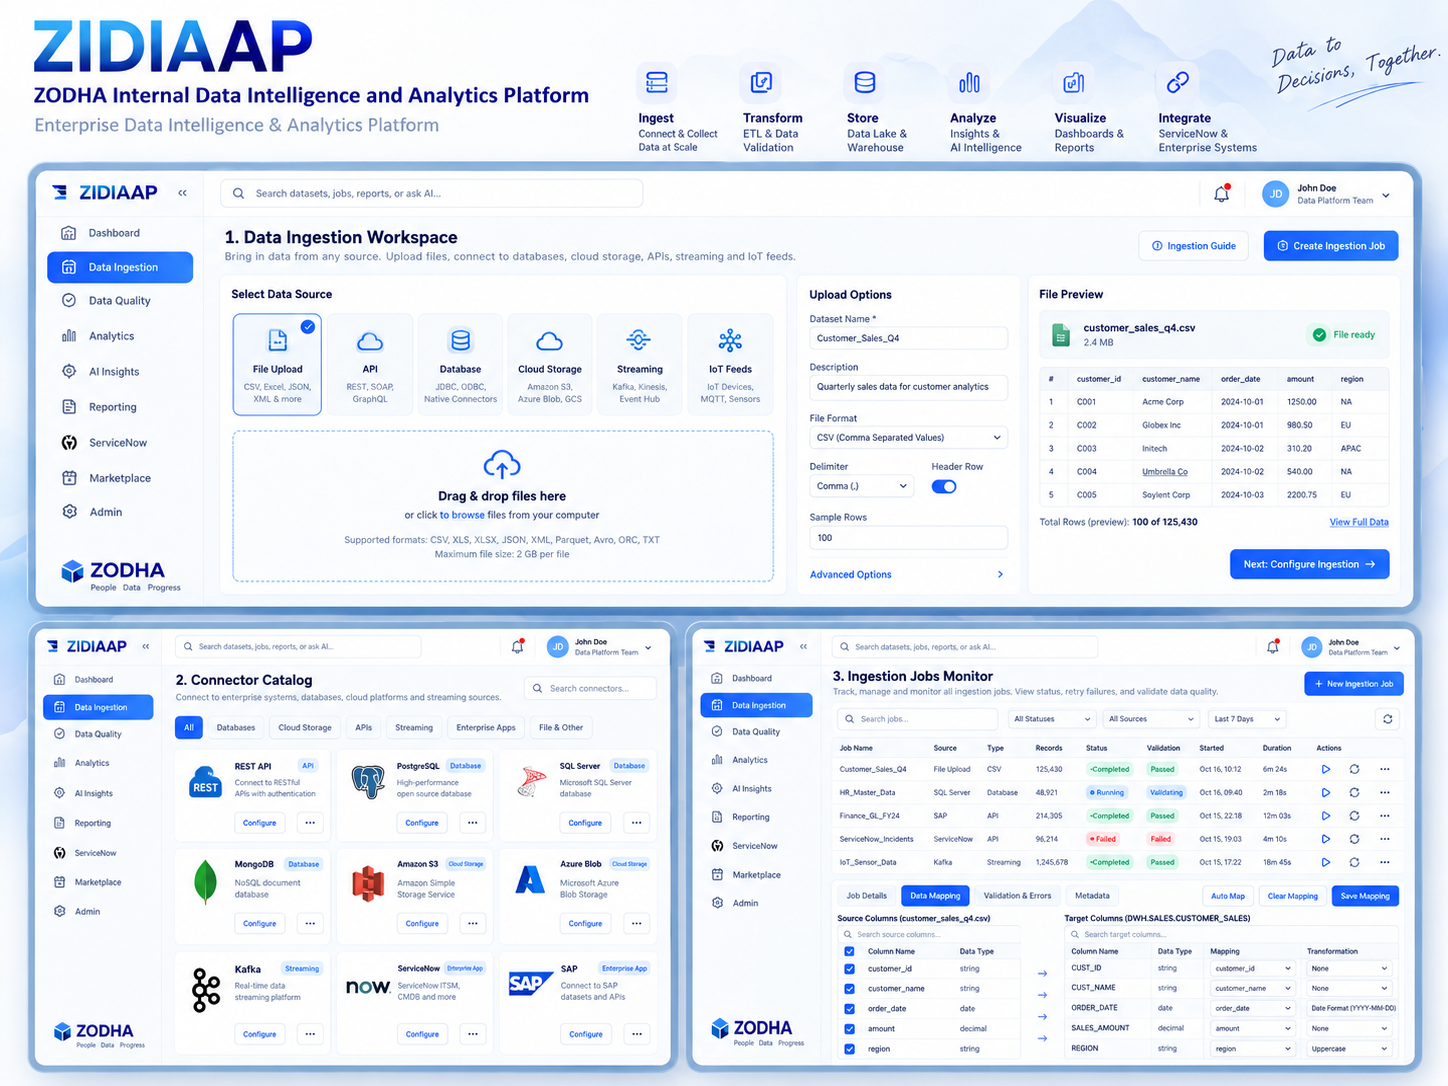
Completed,
Running, Failed), track
validation results, record counts, execution duration,
and start times.
customer_id,
customer_name, order_date,
etc.) with data warehouse target columns, apply
transformations, and validate data types seamlessly.
Understand your data. Ensure quality, compliance, and trust across the enterprise.
The Data Profiling, Governance & Privacy module within ZIDIAAP helps enterprise teams measure data quality, manage stewardship workflows, track end-to-end data lineage, and protect sensitive assets across all datasets.
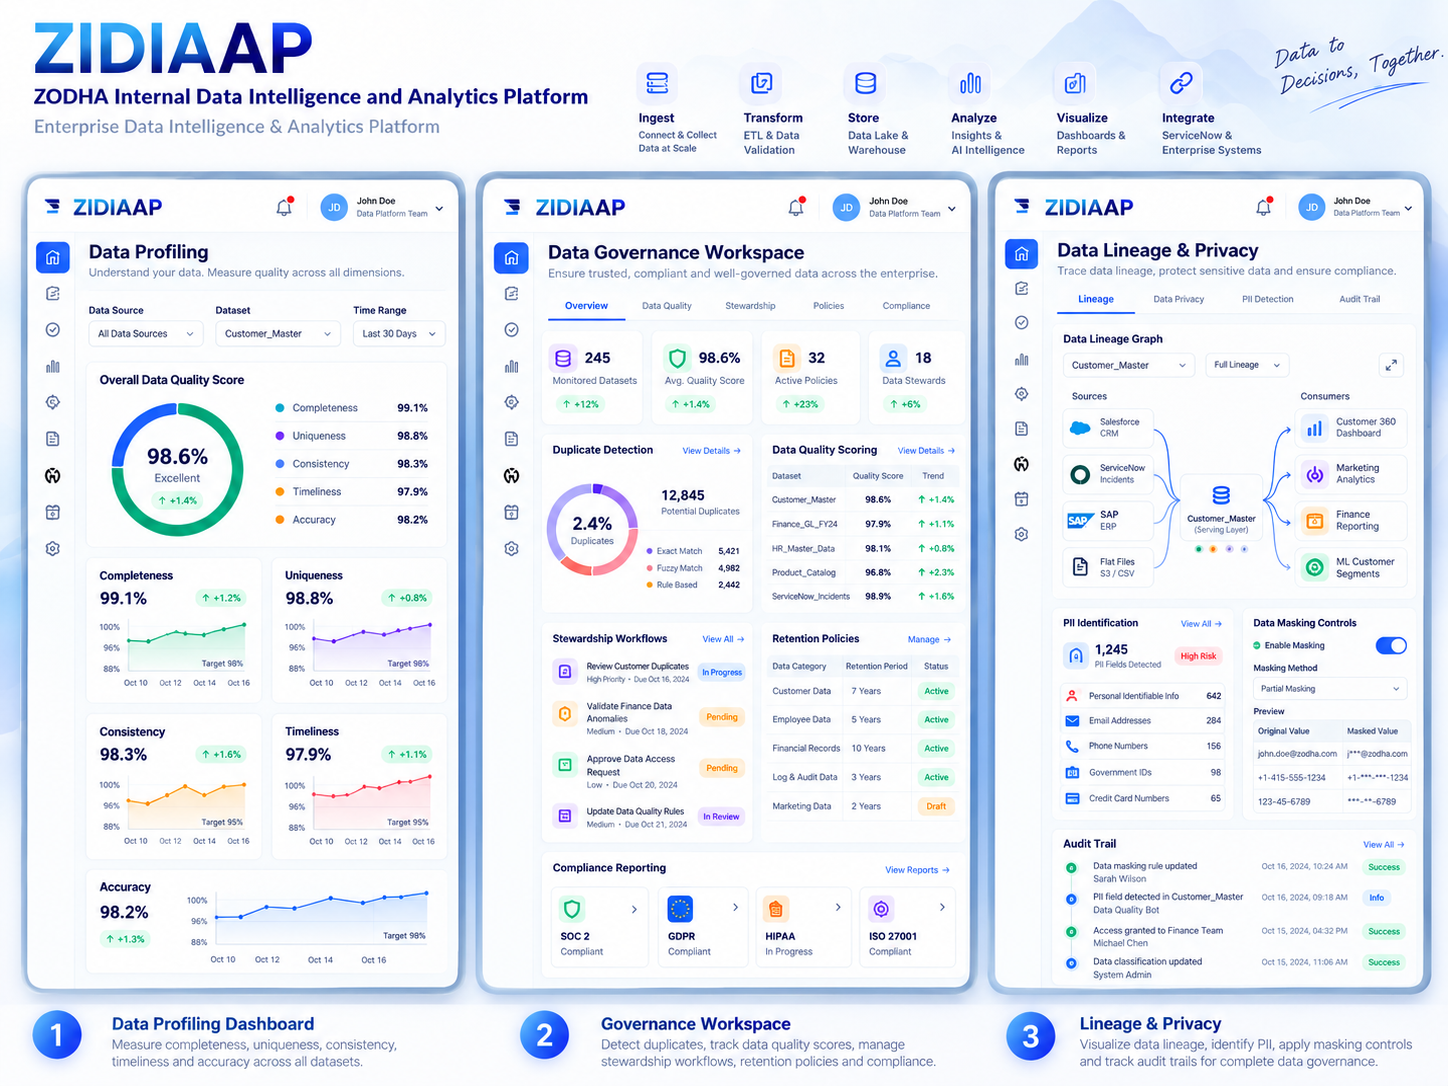
Overall Data Quality Score: 98.6%
| Quality dimension | Score | Target |
|---|---|---|
| Completeness | 99.1% | Against benchmark |
| Uniqueness | 98.8% | Against benchmark |
| Consistency | 98.3% | Against benchmark |
| Timeliness | 97.9% | Against benchmark |
| Accuracy | 98.2% | Against benchmark |
Track individual dimension performance over customizable time ranges. Granular trend lines help teams identify and resolve data degradation early.
12,845 potential duplicates identified across the enterprise.
Review detailed match analysis to investigate potential duplicates and assign follow-up actions.
Manage review cycles, validate data anomalies, and track automated retention policies with clear ownership and status.
Monitor compliance posture and maintain audit-ready reporting across applicable frameworks.
Trace data from source systems through storage to consuming tools:
Automatically detect and inventory high-risk Personally Identifiable Information (PII) fields.
Enable masking and select a transformation method, such as partial masking, to preview how sensitive values are protected.
| Field | Original value | Masked preview |
|---|---|---|
| jordan@example.com | j*****@example.com | |
| Phone | 201-555-4821 | ***-***-4821 |
| Government ID | 123-45-6789 | ***-**-6789 |
| Credit card | 4111 1111 1111 1048 | **** **** **** 1048 |
Masking method: Partial Masking
Keep timestamped records of data classification updates, rule changes, and permissions granted to teams.
| Timestamp | Activity | Actor |
|---|---|---|
| Data classification updated | Data steward | |
| Masking rule changed | Governance administrator | |
| Access permission granted to a team | Governance administrator |
Predict. Explain. Optimize. Accelerate Decisions with AI.
The AI & Machine Learning Insights module within ZIDIAAP empowers enterprise teams to look beyond historical data with predictive modeling, automated anomaly detection, conversational analytics, and end-to-end model management.
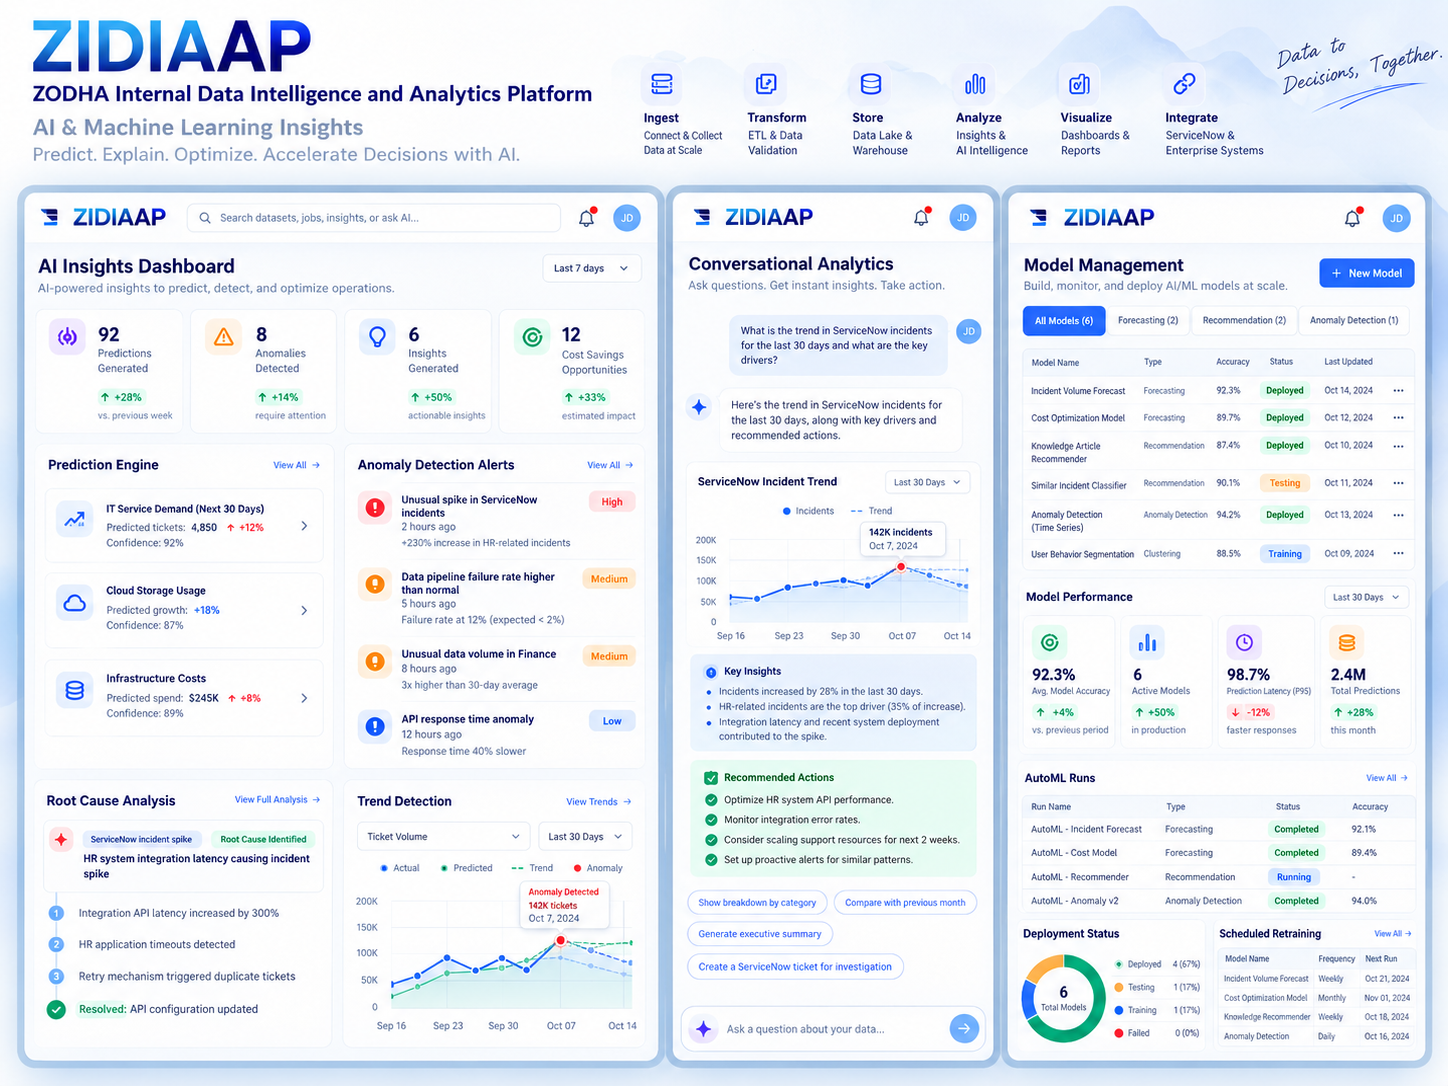
Forecast future operational and financial metrics with confidence indicators.
Monitor real-time alerts, prioritize by severity, and route investigation to the appropriate team.
| Alert | Severity | Signal |
|---|---|---|
| Unusual incident spike | High | ServiceNow incident volume increased |
| Pipeline failure rate | Medium | Failures above expected baseline |
| API response time | Low | Response latency trending upward |
Automatically surface likely drivers behind critical changes. For example, trace a ServiceNow incident spike to latency in the HR system integration.
Ask plain-English questions about enterprise data and get timely, context-aware insights.
“How have ServiceNow incidents trended over the last 30 days?”
Review automated explanations that identify primary drivers, affected categories, and correlations with system deployments.
Build, monitor, and deploy AI/ML models at scale across forecasting, recommendation, and anomaly detection use cases.
Manage AutoML runs by execution status and oversee scheduled retraining frequencies to maintain model performance.
Analyze, visualize, and share actionable operational insights.
The Analytics & Reports module within ZIDIAAP gives enterprise teams a powerful workbench and report builder to explore data, create interactive dashboards, and perform deep OLAP-style cross-dimensional analysis.
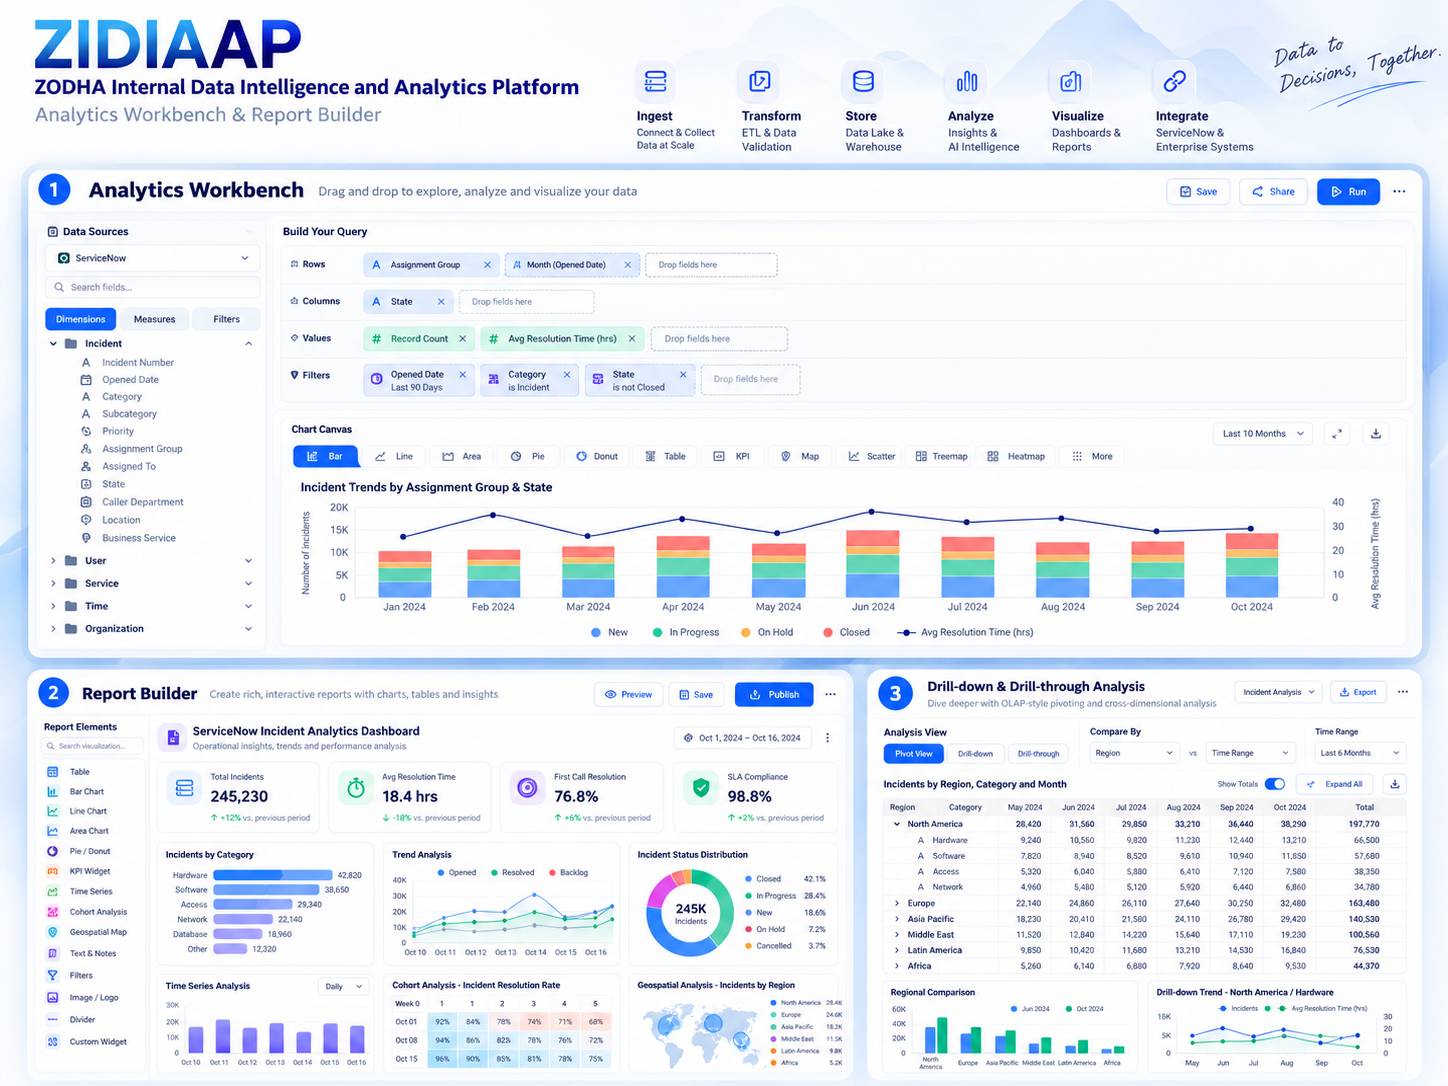
Drag and drop dimensions, measures, and filters to explore, analyze, and visualize data on the fly.
Switch between visualization styles to suit the analysis:
Run, save, and share custom queries to monitor metrics such as incident trends by assignment group and state over custom date ranges.
Build comprehensive reports using a drag-and-drop palette of tables, charts, KPI widgets, time series, cohort analysis, geospatial maps, and custom widgets.
Bring key operational metrics together in one view:
| Metric | Value |
|---|---|
| Total incidents | 245,230 |
| Average resolution time | 18.4 hrs |
| First-call resolution | 76.8% |
| SLA compliance | 98.8% |
Preview, save, and publish interactive reports with automated trend analysis and status distributions.
Explore data using OLAP-style pivoting across regions, categories, and time frames.
Expand regional summaries to examine granular hierarchical breakdowns and compare performance.
Review regional metrics by category and time period.
Review regional metrics by category and time period.
Review regional metrics by category and time period.
Review regional metrics by category and time period.
Total summaries are available across regional breakdowns.
Export customized analytical views and regional comparisons to share findings with enterprise stakeholders.
Empower every user to build, schedule, and access insights anywhere.
The Self-Service Reporting & Mobile Dashboards module within ZIDIAAP enables business users, analysts, and leaders to create personalized views, automate report distribution, and stay connected to critical metrics on any device.
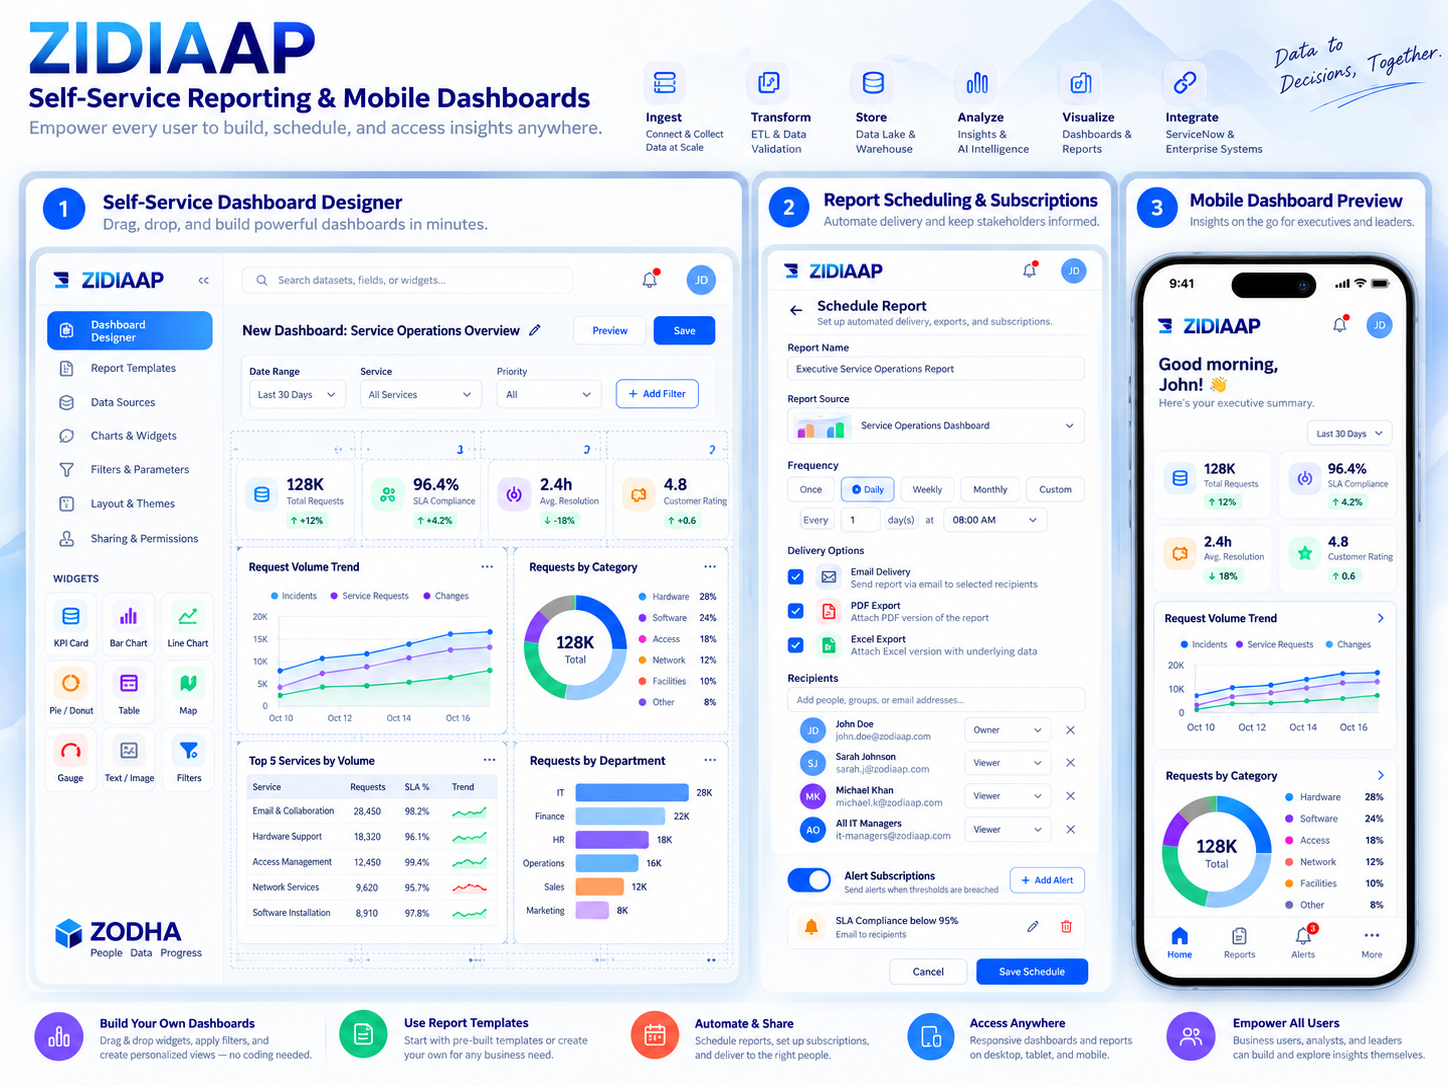
Quickly construct custom dashboards in minutes with a no-code, drag-and-drop designer.
Arrange dashboard views using widgets such as:
Apply global filters for date ranges, services, and priorities to adapt workspace analytics instantly.
Schedule reports for daily, weekly, monthly, or custom delivery frequencies to keep stakeholders informed.
Distribute reports by email with PDF and Excel attachments, including underlying data where needed.
Configure conditional alerts and notifications when thresholds are breached, such as a drop in SLA compliance.
Access responsive dashboards and reports optimized for smartphones and tablets.
Track essential operational metrics directly from a mobile device:
Discover, share, and accelerate business value with trusted enterprise data and templates.
The Data Marketplace & Industry Solutions module within ZIDIAAP provides a central hub for discovering, subscribing to, and leveraging verified datasets and pre-built industry templates across your organization.
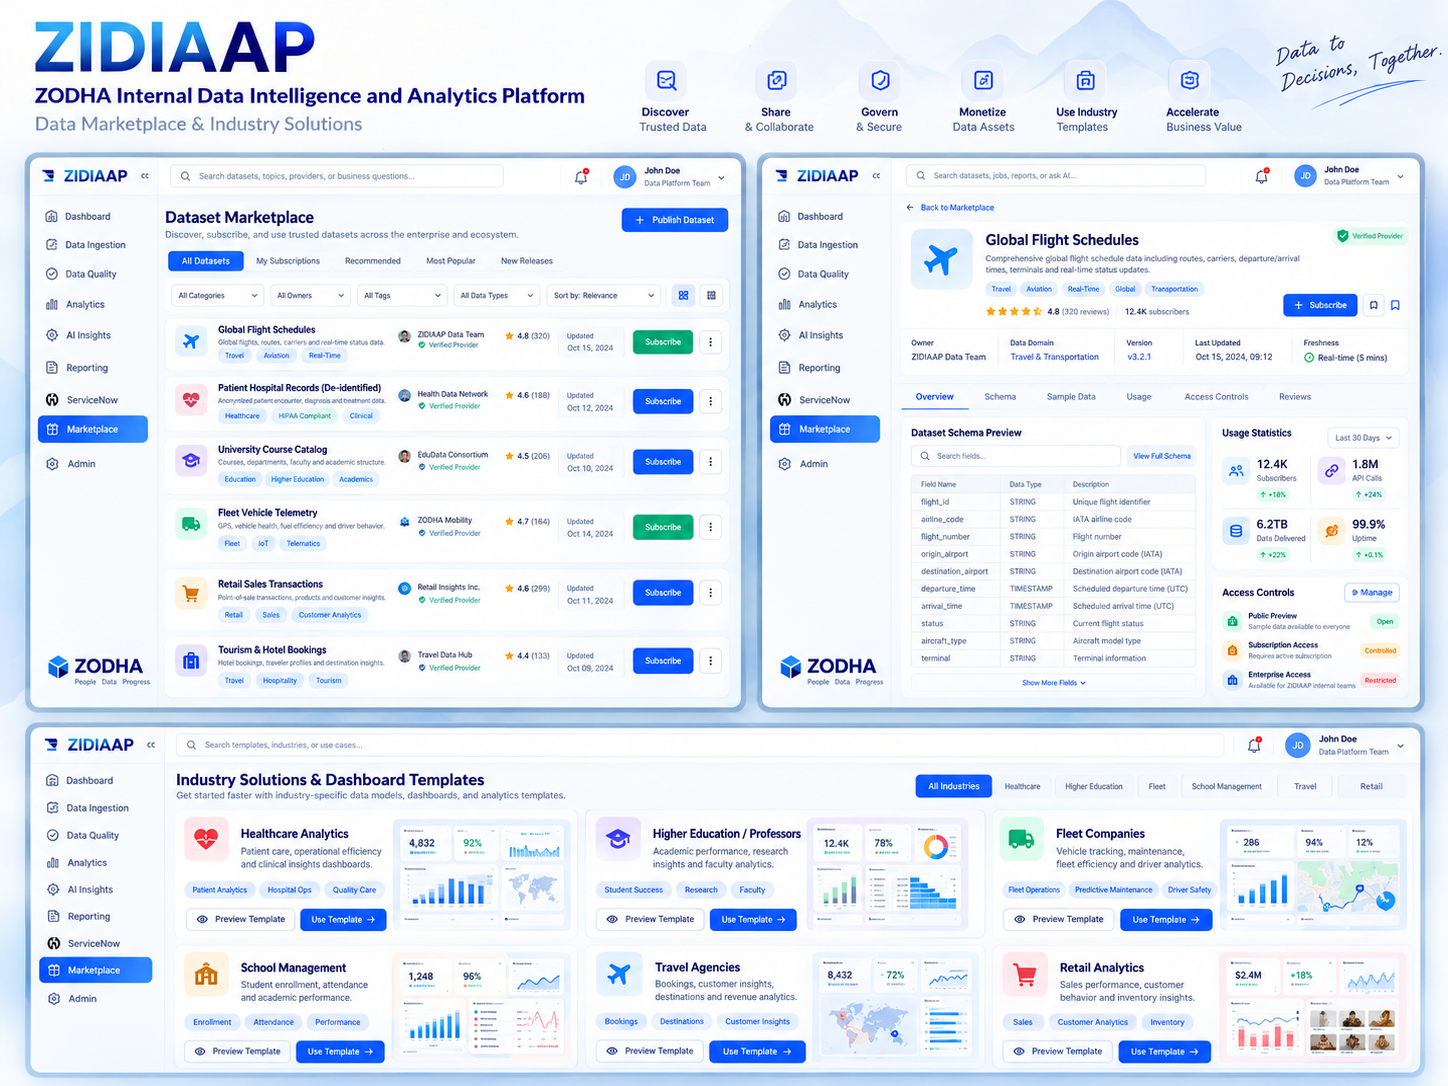
Browse, search, and subscribe to trusted datasets from across the enterprise and its data ecosystem.
Inspect dataset schemas, sample data, usage statistics, access controls, and peer reviews before subscribing.
Publish new datasets with verified provider credentials to foster trusted cross-departmental collaboration.
Jumpstart analytics with industry-specific data models, dashboards, and templates tailored for:
Preview template metrics and layouts, then select Use Template to provision pre-configured operational insights for your business domain.
Seamless Integration. Unified IT Operations. Greater Insights.
The ServiceNow Integration Center within ZIDIAAP enables enterprise teams to connect, synchronize, and analyze ITSM data across enterprise systems to drive faster decision-making.
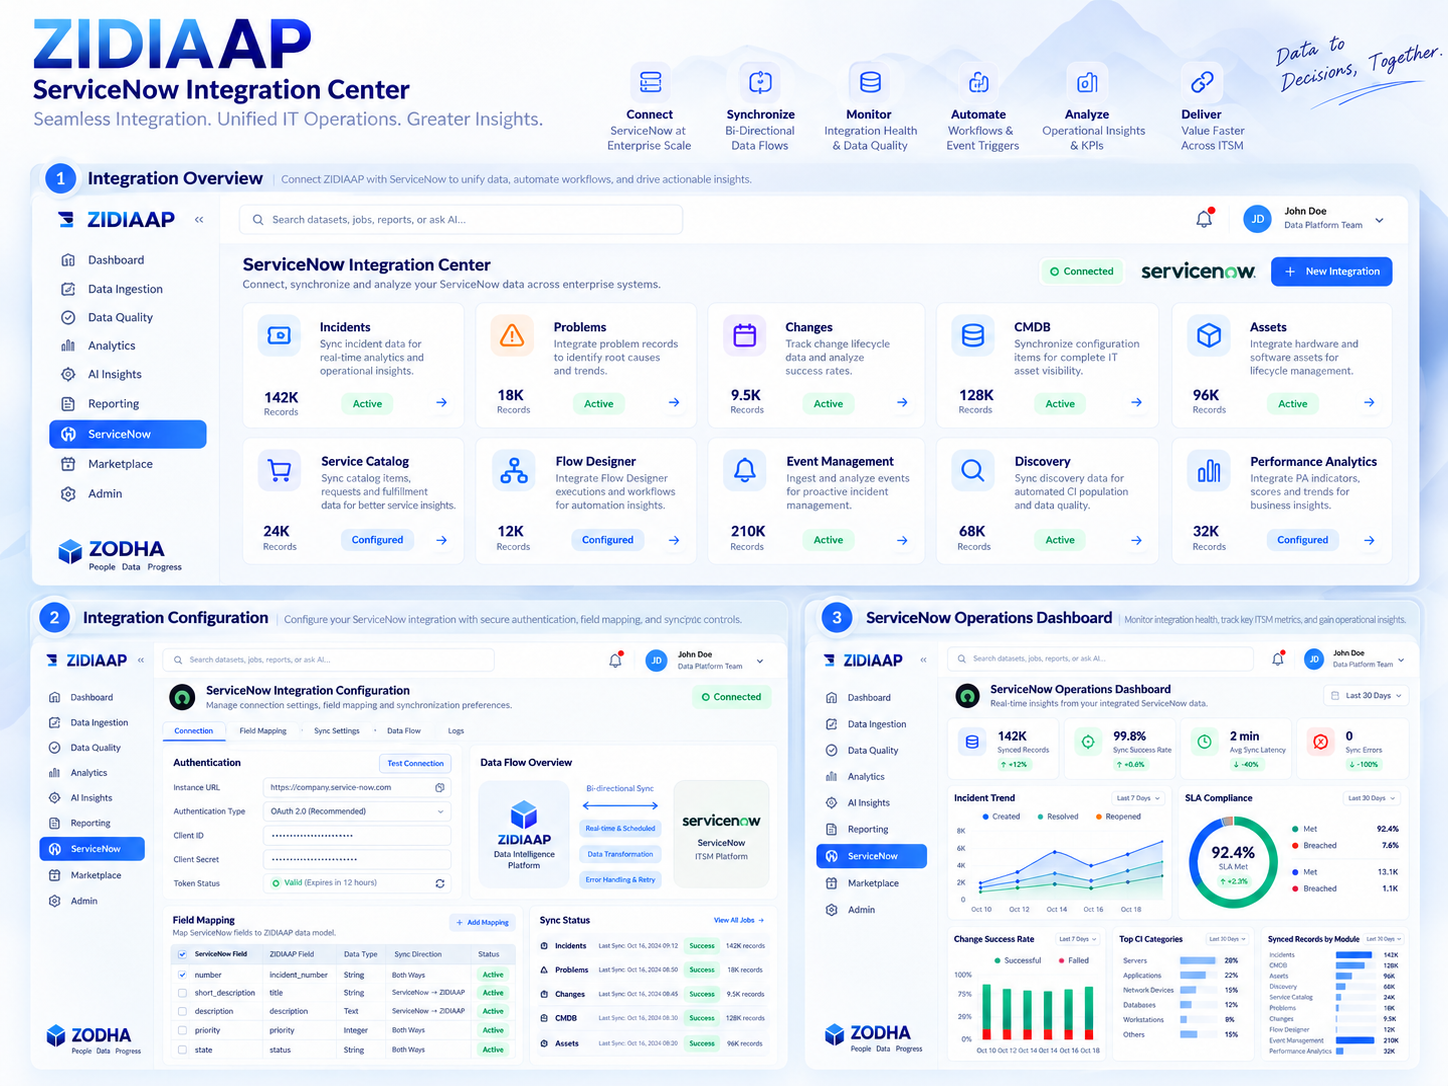
Connect ZIDIAAP with ServiceNow at enterprise scale to synchronize core operational data.
Monitor active record counts and statuses across ServiceNow modules:
| ServiceNow module | Records |
|---|---|
| Incidents | 142K |
| Problems | 18K |
| Changes | 9.5K |
| CMDB configuration items | 128K |
| Assets | 96K |
| Service Catalog items | Monitored |
| Flow Designer | Monitored |
| Event Management | Monitored |
| Discovery | Monitored |
| Performance Analytics | Monitored |
Configure a secure OAuth 2.0 connection with the ServiceNow instance URL and client credentials, then track token validation status.
Map ServiceNow fields directly to ZIDIAAP data models and configure sync direction and active status.
| ServiceNow field | ZIDIAAP field | Sync direction | Status |
|---|---|---|---|
number |
Incident ID | Both Ways | Active |
short_description |
Incident summary | ServiceNow to ZIDIAAP | Active |
state |
Incident state | Both Ways | Active |
Manage real-time and scheduled synchronization, data transformation, and automated error handling across integration flows.
Enterprise administration, advanced security, system health monitoring, and compliance management.
The Administration & Monitoring module within ZIDIAAP provides enterprise administrators with a command center to manage tenants, enforce security policies, monitor infrastructure health, and track audit logs across the platform.
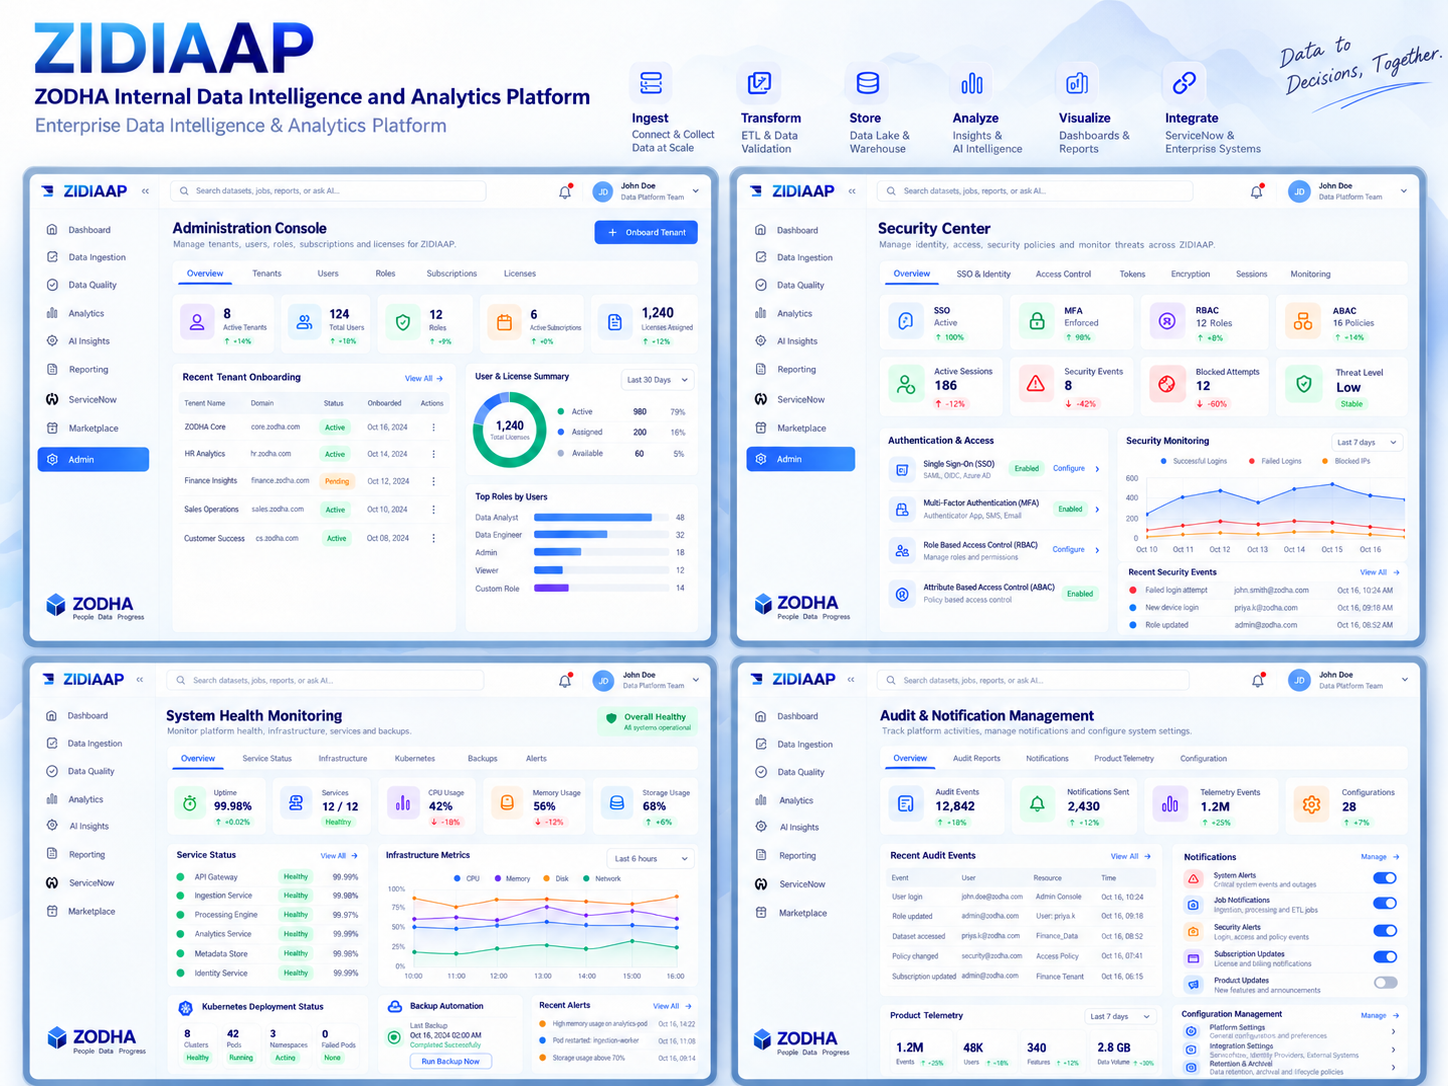
Onboard new tenants and review user and license distribution across active, assigned, and available allocations.
Track recent tenant onboarding records and their status:
Track successful and failed login attempts and blocked IP activity over time. Review recent security events, including login attempts and permission updates.
Overall platform uptime: 99.98%. Monitor the health of core services:
Monitor Kubernetes cluster and pod deployment status, including active and unavailable pods. Manage automated backups and review recent backup alerts.
Review 12,842 historical audit events with user, resource, and timestamp details.
Configure and govern platform-wide settings for:


